In the previous chapters, we learned how to setup highcharts library and how to create a chart with required configurations using highcharts library in our webpage. Now, we will learn how to create a variwide chart using highcharts library with examples.
Following is the example of creating a variwide chart by setting the required chart properties using highcharts library.
<html>
<head>
<title>Highcharts Variwide Chart</title>
<script src="https://code.jquery.com/jquery-3.4.1.min.js"></script>
<script src="https://code.highcharts.com/highcharts.js"></script>
<script src="https://code.highcharts.com/modules/variwide.js"></script>
<script type="text/javascript">
$(function() {
Highcharts.chart('container', {
chart: {
type: 'variwide'
},
title: {
text: 'Labor Costs in Europe, 2016'
},
subtitle: {
text: 'Source: eurostat'
},
xAxis: {
type: 'category',
title: {
text: 'Column widths are proportional to GDP'
}
},
legend: {
enabled: false
},
series: [{
name: 'Labor Costs',
data: [
['Norway', 50.2, 335504],
['Denmark', 42, 277339],
['Belgium', 39.2, 421611],
['Sweden', 38, 462057],
['France', 35.6, 2228857],
['Netherlands', 34.3, 702641],
['Finland', 33.2, 215615],
['Germany', 33.0, 3144050],
['Austria', 32.7, 349344],
['Ireland', 30.4, 275567],
['Italy', 27.8, 1672438],
['United Kingdom', 26.7, 2366911],
['Spain', 21.3, 1113851],
['Greece', 14.2, 175887],
['Portugal', 13.7, 184933],
['Czech Republic', 10.2, 176564],
['Poland', 8.6, 424269],
['Romania', 5.5, 169578]
],
dataLabels: {
enabled: true,
format: '€{point.y:.0f}'
},
tooltip: {
pointFormat: 'Labor Costs: <b>€ {point.y}/h</b><br>' +
'GDP: <b>€ {point.z} million</b><br>'
},
colorByPoint: true
}]
});
});
</script>
</head>
<body>
<div id="container"></div>
</body>
</html>
If you observe the above example, we created a variwide chart using highcharts library with required properties.
When we execute the above highcharts example, we will get the result like as shown below.
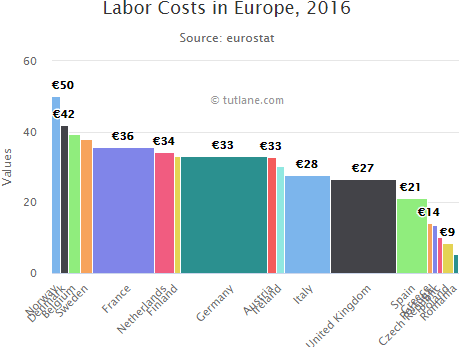
This is how we can create a variwide chart using highcharts library with required properties.