In the previous chapters, we learned how to setup highcharts library and how to create a chart with required configurations using highcharts library in our webpage. Now, we will learn how to create a 3d pie chart using highcharts library with examples.
Following is the example of creating a 3D pie chart by setting the required chart properties using highcharts library.
<html>
<head>
<title>Highcharts 3D Pie Chart</title>
<script src="https://code.jquery.com/jquery-3.4.1.min.js"></script>
<script src="https://code.highcharts.com/highcharts.js"></script>
<script src="https://code.highcharts.com/highcharts-3d.js"></script>
<script src="https://code.highcharts.com/modules/exporting.js"></script>
<script src="https://code.highcharts.com/modules/export-data.js"></script>
<script type="text/javascript">
$(function() {
Highcharts.chart('container', {
chart: {
type: 'pie',
options3d: {
enabled: true,
alpha: 45,
beta: 0
}
},
title: {
text: 'Browser market shares, 2014'
},
tooltip: {
pointFormat: '{series.name}: <b>{point.percentage:.1f}%</b>'
},
plotOptions: {
pie: {
allowPointSelect: true,
cursor: 'pointer',
depth: 35,
dataLabels: {
enabled: true,
format: '{point.name}'
}
}
},
series: [{
type: 'pie',
name: 'Browser share',
data: [
['Firefox', 45.0],
['IE', 26.8], {
name: 'Chrome',
y: 12.8,
sliced: true,
selected: true
},
['Safari', 8.5],
['Opera', 6.2],
['Others', 0.7]
]
}]
});
});
</script>
</head>
<body>
<div id="container" style="width: 100%; height: 400px;"> </div>
</body>
</html>
If you observe the above example, we created a 3D pie chart using highcharts library with required properties.
When we execute the above highcharts example, we will get the result like as shown below.
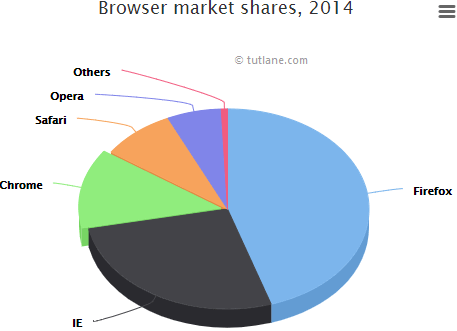
This is how we can create a 3D pie chart using highcharts library with required properties.