In the previous chapters, we learned how to setup highcharts library and how to create a chart with required configurations using highcharts library in our webpage. Now, we will learn how to create a polar chart using highcharts library with examples.
Following is the example of creating a polar chart by setting the required chart properties using highcharts library.
<html>
<head>
<title>Highcharts Polar Chart</title>
<script src="https://code.jquery.com/jquery-3.4.1.min.js"></script>
<script src="https://code.highcharts.com/highcharts.js"></script>
<script src="https://code.highcharts.com/highcharts-more.js"></script>
<script src="https://code.highcharts.com/modules/exporting.js"></script>
<script src="https://code.highcharts.com/modules/export-data.js"></script>
<script type="text/javascript">
$(function() {
Highcharts.chart('container', {
chart: {
polar: true
},
title: {
text: 'Highcharts Polar Chart'
},
subtitle: {
text: 'Also known as Radar Chart'
},
pane: {
startAngle: 0,
endAngle: 360
},
xAxis: {
tickInterval: 45,
min: 0,
max: 360,
labels: {
format: '{value}°'
}
},
yAxis: {
min: 0
},
plotOptions: {
series: {
pointStart: 0,
pointInterval: 45
},
column: {
pointPadding: 0,
groupPadding: 0
}
},
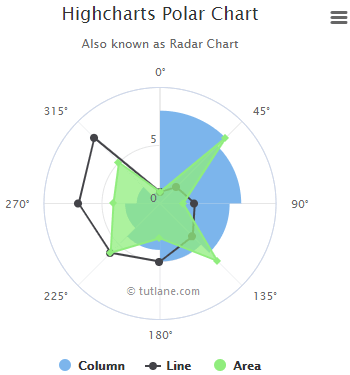
series: [{
type: 'column',
name: 'Column',
data: [8, 7, 6, 5, 4, 3, 2, 1],
pointPlacement: 'between'
}, {
type: 'line',
name: 'Line',
data: [1, 2, 3, 4, 5, 6, 7, 8]
}, {
type: 'area',
name: 'Area',
data: [1, 8, 2, 7, 3, 6, 4, 5]
}]
});
});
</script>
</head>
<body>
<div id="container" style="min-width: 310px; max-width: 400px; height: 400px; margin: 0 auto"></div>
</body>
</html>
If you observe the above example, we created a polar chart using highcharts library with required properties.
When we execute the above highcharts example, we will get the result like as shown below.
This is how we can create a polar chart using highcharts library with required properties.