In the previous chapters, we learned how to setup highcharts library and how to create a chart with required configurations using highcharts library in our webpage. Now, we will learn how to create a pie chart with monochrome fill using highcharts library with examples.
Following is the example of creating a pie chart with monochrome fill by setting the required chart properties using highcharts library.
<html>
<head>
<title>Highcharts Monochrome Fill Pie Chart</title>
<script src="https://code.jquery.com/jquery-3.4.1.min.js"></script>
<script src="https://code.highcharts.com/highcharts.js"></script>
<script src="https://code.highcharts.com/modules/exporting.js"></script>
<script src="https://code.highcharts.com/modules/export-data.js"></script>
<script type="text/javascript">
$(function() {
// Make monochrome colors
var pieColors = (function() {
var colors = [],
base = Highcharts.getOptions().colors[0],
i;
for (i = 0; i < 10; i += 1) {
// Start out with a darkened base color (negative brighten), and end
// up with a much brighter color
colors.push(Highcharts.Color(base).brighten((i - 3) / 7).get());
}
return colors;
}());
// Build the chart
Highcharts.chart('container', {
chart: {
plotBackgroundColor: null,
plotBorderWidth: null,
plotShadow: false,
type: 'pie'
},
title: {
text: 'Browser market shares, 2014'
},
tooltip: {
pointFormat: '{series.name}: <b>{point.percentage:.1f}%</b>'
},
plotOptions: {
pie: {
allowPointSelect: true,
cursor: 'pointer',
colors: pieColors,
dataLabels: {
enabled: true,
format: '<b>{point.name}</b><br>{point.percentage:.1f} %',
distance: -50,
filter: {
property: 'percentage',
operator: '>',
value: 4
}
}
}
},
series: [
{
name: 'Share',
data: [
{name: 'Chrome',y: 61.41},
{name: 'Internet Explorer',y: 11.84},
{name: 'Firefox',y: 10.85},
{name: 'Edge',y: 4.67},
{name: 'Safari',y: 4.18},
{name: 'Other',y: 7.05}
]
}]
});
});
</script>
</head>
<body>
<div id="container" style="width: 100%; height: 400px;"> </div>
</body>
</html>If you observe the above example, we created a pie chart with monochrome fill options using highcharts library with required properties.
When we execute the above highcharts example, we will get the result like as shown below.
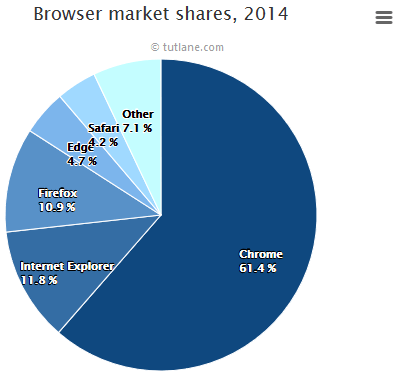
This is how we can create a pie chart with monochrome fill using highcharts library with required properties.